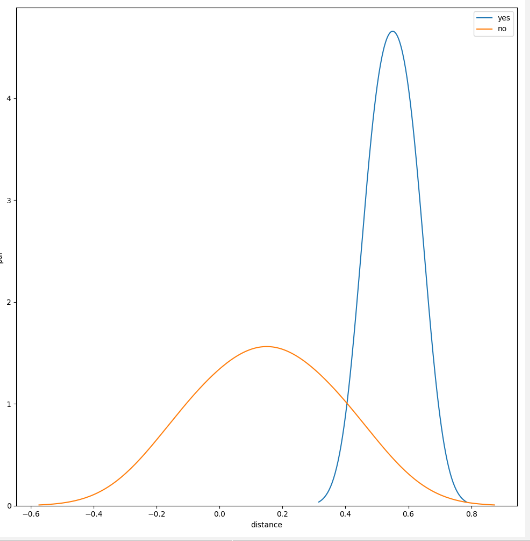
In voiceprint and face recognition, one of the important things is to determine similarity threshold. In this tutorial, we will introduce you how to get this threshold value.
Another important thing is to compute EER metrics. You can view this tutorial:
How to Compute EER Metrics in Voiceprint and Face Recognition – Machine Leaning Tutorial
How to determine similarity threshold?
If we have a test set as follows:

As to label = 1, it means two samples are the same. In voiceprint recognition, these wav files are spoken by the same person.
However, label = 0, it means these two wav files are spoken by two different persons.
Moreover, label = 1, we will get a high similarity. label = 0, we will get a low similarity.
Then, we will determine the similarity threshold by labels and similarity distance.
We will show you an example.
First, we should import some python libraries.
import numpy as np
import matplotlib.pyplot as plt
import random
import pandas as pd
from collections import defaultdict
import seaborn as sns
Then, we will get labels and similarity distance.
For example:
similarity_dist = [0.1, 0.5, 0.2, -0.1, 0.4, 0.6]
labels          = ["0", "1", "0", "0", "0", "1"]
Then we can determine similarity threshold as follows:
def plot_threshold(dist_values, same_or_not):
    df = pd.DataFrame(np.vstack((dist_values, same_or_not)).T, columns=['distance', 'labels'])
    print(df['labels'].value_counts())

    plt.figure(figsize=(10,10))
    sns.kdeplot(np.array(df.loc[df['labels'] == '1']['distance'], dtype=np.float), label='yes')
    sns.kdeplot(np.array(df.loc[df['labels'] == '0']['distance'], dtype=np.float), label='no')
    plt.xlabel('distance')
    plt.ylabel('pdf')
    plt.legend()
    plt.show()

plot_threshold(similarity_dist, labels)
Run this code, we will see:

From image above, we can find the similarity threshold = 0.4.
When sim_dist > 0.4, the label = 1. Otherwise, label = 0