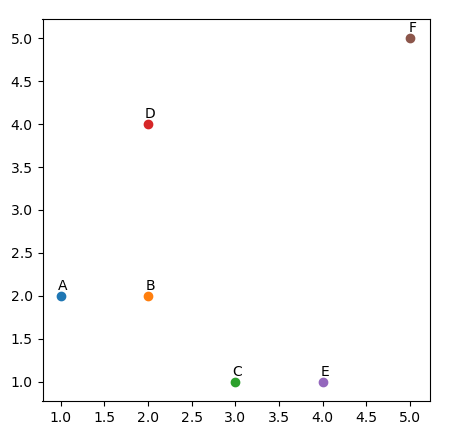
We can use python matplot to implement a scatter plot easily, Here is an example.
Best Practice to Implement Scatter Plot with Matplotlib – Matplotlib Tutorial
However, these scatter point are not annotated. In this tutorial, we will introduce how to create a scatter plot with labels for python beginners.
Preliminaries
We should import python matplotlib library.
#-*- coding: UTF-8 -*-
import matplotlib.pyplot as plt
If you have not installed this library, you can read this tutorial to learn how to install.
Create some scatter points and labels
In this example, we will create 6 points and labels, they are:
coord = [(1, 2), (2, 2), (3, 1), (2, 4), (4, 1), (5, 5)]
labels = ['A', 'B', 'C', 'D', 'E', 'F']
Show scatter points with labels
We will create a python function to do it. Here is an eample:
def plot_with_labels(coord, labels):
    assert len(coord) == len(labels), 'coord len is not equal to labels len'
    plt.figure(figsize=(5, 5))  # in inches
    for i, label in enumerate(labels): #get (0, label)
        x, y = coord[i] #2 dim
        plt.scatter(x, y)
                #
        plt.annotate(label,
                xy=(x, y), #show point
                xytext=(5, 2), #show annotate
                textcoords='offset points',
                ha='right',
                va='bottom')
    plt.show()
First, we will check the length of coord and labels are the same or not by python assert statement. To understand assert statement, you can read this tutorial.
Understand Python Assert Statements for Beginners – Python Tutorial
Then, we will use plt.scatter(x, y) to draw these scatter points.
Finally, we will use plt.annotate() function to display labels of these scatter points.
How to use plot_with_labels()?
We can use this function like this:
plot_with_labels(coord, labels)
Run this python script, we will get a plot like below.

From the graph, we can find each coord is displayed with its label.