Matplotlib plt.subplot() function can allow us to display some graphics in one figure. In this tutorial, we will introdue how to use this function by using some examples.
Syntax
plt.subplot(nrows, ncols, index, **kwargs)
nrows and ncols determines how many subplots will be created.
index determines the position of current subplots.
Here is an example to show the location of subplots in matplotlib.

How to use plt.subplot()?
We will use some examples to show you how to use this function.
import matplotlib.pyplot as plt
import numpy as np

t=np.arange(0.0,2.0,0.1)
s=np.sin(t*np.pi)

#plot 1
plt.subplot(2,2,1)
plt.plot(t,s,'b--')
plt.ylabel('y1')

#plot 2
plt.subplot(2,2,2)
plt.plot(2*t,s,'r--')
plt.ylabel('y2')

#subplot 3
plt.subplot(2,2,3)
plt.plot(3*t,s,'m--')
plt.ylabel('y3')

#subplot 4
plt.subplot(2,2,4)
plt.plot(4*t,s,'k--')
plt.ylabel('y4')
plt.show()
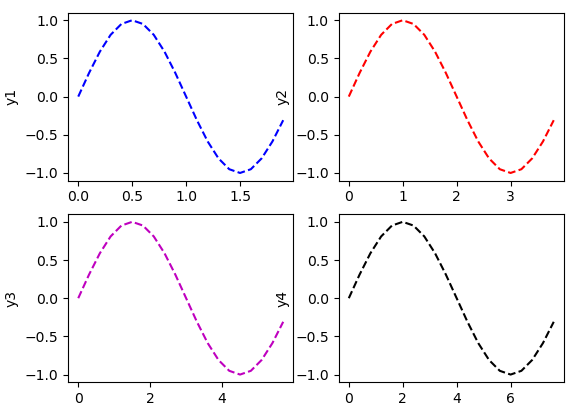
In code above, we will create 4 subplots in one figure.
Run this code, you will get this result:

We also can use matplotlib Axes to control subplots. Here is an example:
import matplotlib.pyplot as plt
import numpy as np

t=np.arange(0.0,2.0,0.1)
s=np.sin(t*np.pi)


figure,ax=plt.subplots(2,2)

#plot 1
ax[0][0].plot(t,s,'b--')
ax[0][0].set_ylabel('y1')

#plot 2
ax[0][1].plot(2*t,s,'r--')
ax[0][1].set_ylabel('y2')

#subplot 3
ax[1][0].plot(3*t,s,'m--')
ax[1][0].set_ylabel('y3')

#subplot 4
ax[1][1].plot(4*t,s,'k--')
ax[1][1].set_ylabel('y4')
plt.show()
Run this code, we also can get the result:
