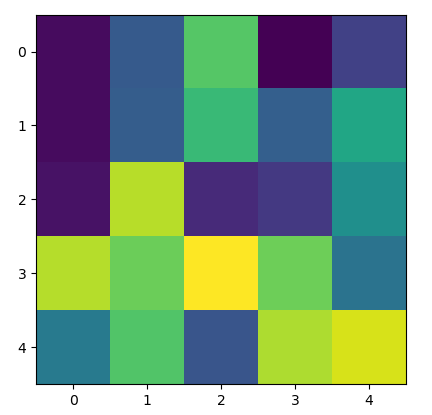
matplotlib.pyplot.imshow() can display data as an image file, we will use some examples to show you how to use this function correctly in this tutorial.
Syntax
matplotlib.pyplot.imshow() is defined as:
matplotlib.pyplot.imshow(X, cmap=None, norm=None, aspect=None, interpolation=None, alpha=None, vmin=None, vmax=None, origin=None, extent=None, shape=<deprecated parameter>, filternorm=1, filterrad=4.0, imlim=<deprecated parameter>, resample=None, url=None, \*, data=None, \*\*kwargs)
It can display data X as an image.
Parameters
X: array-like or PIL image
The shape of X can be:
(M, N) : an image with scalar data. The values are mapped to colors using normalization and a colormap
(M, N, 3): an image with RGB values (0-1 float or 0-255 int)
(M, N, 4): an image with RGBA values (0-1 float or 0-255 int)
We should notice: the value of X will be clipped between 0-1.
cmap: the Colormap
We will some examples to show how to use this function.
#-*- coding: UTF-8 -*-
import matplotlib.pyplot as plt
import numpy as np

np.random.seed(21)
data = np.random.rand(25).reshape(5, 5)
plt.imshow(data)
plt.show()
Run this code, you will get this image.

Display image with color green or grey
green color
plt.imshow(data, cmap='Greens')
plt.show()

grey color
plt.imshow(data, cmap='Greys')#
plt.show()

Use aspect
aspect can be {‘equal’, ‘auto’} or float. It can set the ratio of each axis
Here is an example.
plt.imshow(data, aspect= 0.5)#
plt.show()
The image is:

Use origin
It is {‘upper’, ‘lower’}. It determines the position of (0, 0). Default value is upper.
plt.imshow(data, origin = 'lower')#
plt.show()
The image is:

Use vmin and vmax
vmin and vmax limit the value of X
plt.imshow(data, vmin = 0.4, vmax = 0.6)#
plt.show()
The image is:

We can find the values lower than 0.4 or larger than 0.6 will be displayed with the same color.
Use interpolation
interpolation parameter is difficult to understand, we can display the effect of image with different value.

You can select a good value to show image.